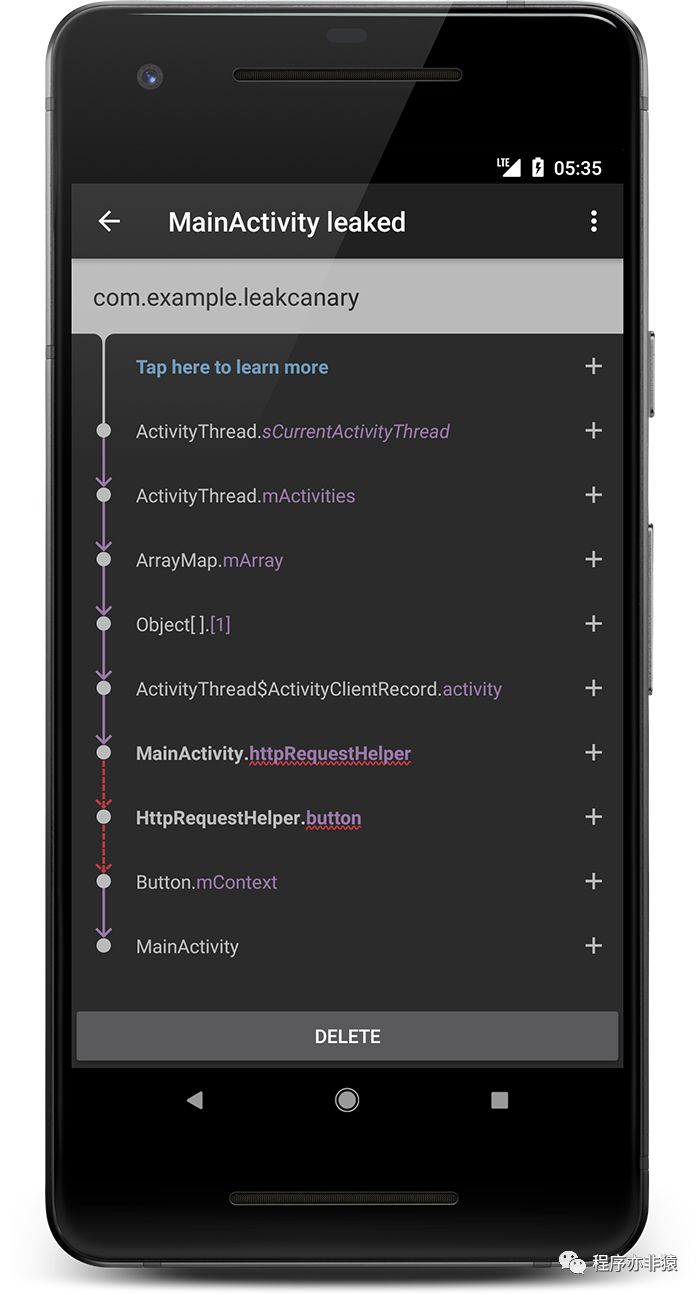
「Leakcanary 」是我们经常用于检测内存泄漏的工具,简单的使用方式,内存泄漏的可视化,是我们开发中必备的工具之一。 分析源码之前 Leakcanary 大神的 github ,最好的老师。 一、使用1、配置1dependencies { 2debugImplementation 'com.squareup.leakcanary:leakcanary-android:1.6.3' 3releaseImplementation 'com.squareup.leakcanary:leakcanary-android-no-op:1.6.3' 4// Optional, if you use support library fragments: 5debugImplementation 'com.squareup.leakcanary:leakcanary-support-fragment:1.6.3' 6} 2、简单使用1publicclassExampleApplicationextendsApplication{ 2 3@OverridepublicvoidonCreate(){ 4super.onCreate(); 5if(LeakCanary.isInAnalyzerProcess( this)) { 6// This process is dedicated to LeakCanary for heap analysis. 7// You should not init your app in this process. 8return; 9} 10LeakCanary.install( this); 11// Normal app init code... 12} 13} 超级简单的配置和使用方式。最后就会得出以下的事例说明。
二、准备工作1、Reference Reference 把内存分为 4 种状态,Active 、 Pending 、 Enqueued 、 Inactive。
引用队列,在 Reference 被回收的时候,Reference 会被添加到 ReferenceQueue 中 3、如果检测一个对象是否被回收 需要采用 Reference + ReferenceQueue
2ReferenceQueue queue = newReferenceQueue(); 3 4// 创建弱引用,此时状态为Active,并且Reference.pending为空, 5// 当前Reference.queue = 上面创建的queue,并且next=null 6// reference 创建并关联 queue 7WeakReference reference = newWeakReference( newObject(), queue); 8 9// 当GC执行后,由于是弱引用,所以回收该object对象,并且置于pending上,此时reference的状态为PENDING 10System.gc(); 11 12// ReferenceHandler从 pending 中取下该元素,并且将该元素放入到queue中, 13//此时Reference状态为ENQUEUED,Reference.queue = ReferenceENQUEUED 14 15// 当从queue里面取出该元素,则变为INACTIVE,Reference.queue = Reference.NULL 16Reference reference1 = queue.remove(); 在 Reference 类加载的时候,Java 虚拟机会会创建一个最大优先级的后台线程,这个线程的工作就是不断检测 pending 是否为 null,如果不为 null,那么就将它放到 ReferenceQueue。因为 pending 不为 null,就说明引用所指向的对象已经被 GC,变成了不也达。 4、ActivityLifecycleCallbacks 用于监听所有 Activity 生命周期的回调方法。 1privatefinalApplication.ActivityLifecycleCallbacks lifecycleCallbacks = 2newApplication.ActivityLifecycleCallbacks() { 3@OverridepublicvoidonActivityCreated(Activity activity, Bundle savedInstanceState){ 4} 5 6@OverridepublicvoidonActivityStarted(Activity activity){ 7} 8 9@OverridepublicvoidonActivityResumed(Activity activity){ 10} 11 12@OverridepublicvoidonActivityPaused(Activity activity){ 13} 14 15@OverridepublicvoidonActivityStopped(Activity activity){ 16} 17 18@OverridepublicvoidonActivitySaveInstanceState(Activity activity, Bundle outState){ 19} 20 21@OverridepublicvoidonActivityDestroyed(Activity activity){ 22ActivityRefWatcher. this.onActivityDestroyed(activity); 23} 24}; 5、Heap Dump Heap Dump也叫堆转储文件,是一个Java进程在某个时间点上的内存快照。 三、原理说明 1、监听 Activity 的生命周期。 2、在 onDestory 的时候,创建对应的 Actitity 的 Refrence 和 相应的 RefrenceQueue,启动后台进程去检测。 3、一段时间后,从 RefrenceQueue 中读取,如果有这个 Actitity 的 Refrence,那么说明这个 Activity 的 Refrence 已经被回收,但是如果 RefrenceQueue 没有这个 Actitity 的 Refrence 那就说明出现了内存泄漏。 4、dump 出 hprof 文件,找到泄漏路径。 分析源码 程序的唯一入口 LeakCanary.install(this); 1、install DisplayLeakService 这个类负责发起 Notification 以及将结果记录下来写在文件里面。以后每次启动LeakAnalyzerActivity就从这个文件里读取历史结果,并展示给我们。 1publicstaticRefWatcher install(Application application){ 2returninstall(application, DisplayLeakService.class); 3} 1publicstaticRefWatcher install(Application application, 2Class listenerServiceClass){ 百万 源码3//如果在主线程 那么返回一个无用的 RefWatcher 详解 1.1 4if(isInAnalyzerProcess(application)) { 5returnRefWatcher.DISABLED; 6} 7//把 DisplayLeakActivity 设置为可用 用于显示 DisplayLeakActivity 就是我们看到的那个分析界面 
|